Written by Jorge Argota · Legal Marketing · United States
I was looking at a screen recording of a mobile search for “personal injury lawyer near me” last month and I started counting how far down the page you had to scroll before the map results showed up. Three Local Service Ads at the top with the Google Screened badges. Then two paid search text ads underneath those.
Then an AI Overview that Google triggered, which happens on 77.67% of legal queries now. And then finally the map pack, maybe a screen and a half below where you started. I watched the recording three times because I kept thinking I was missing something but that was it; the organic map results that most firms think of as their primary visibility channel don’t appear until the user has already scrolled past everything Google gets paid for.
TL;DR
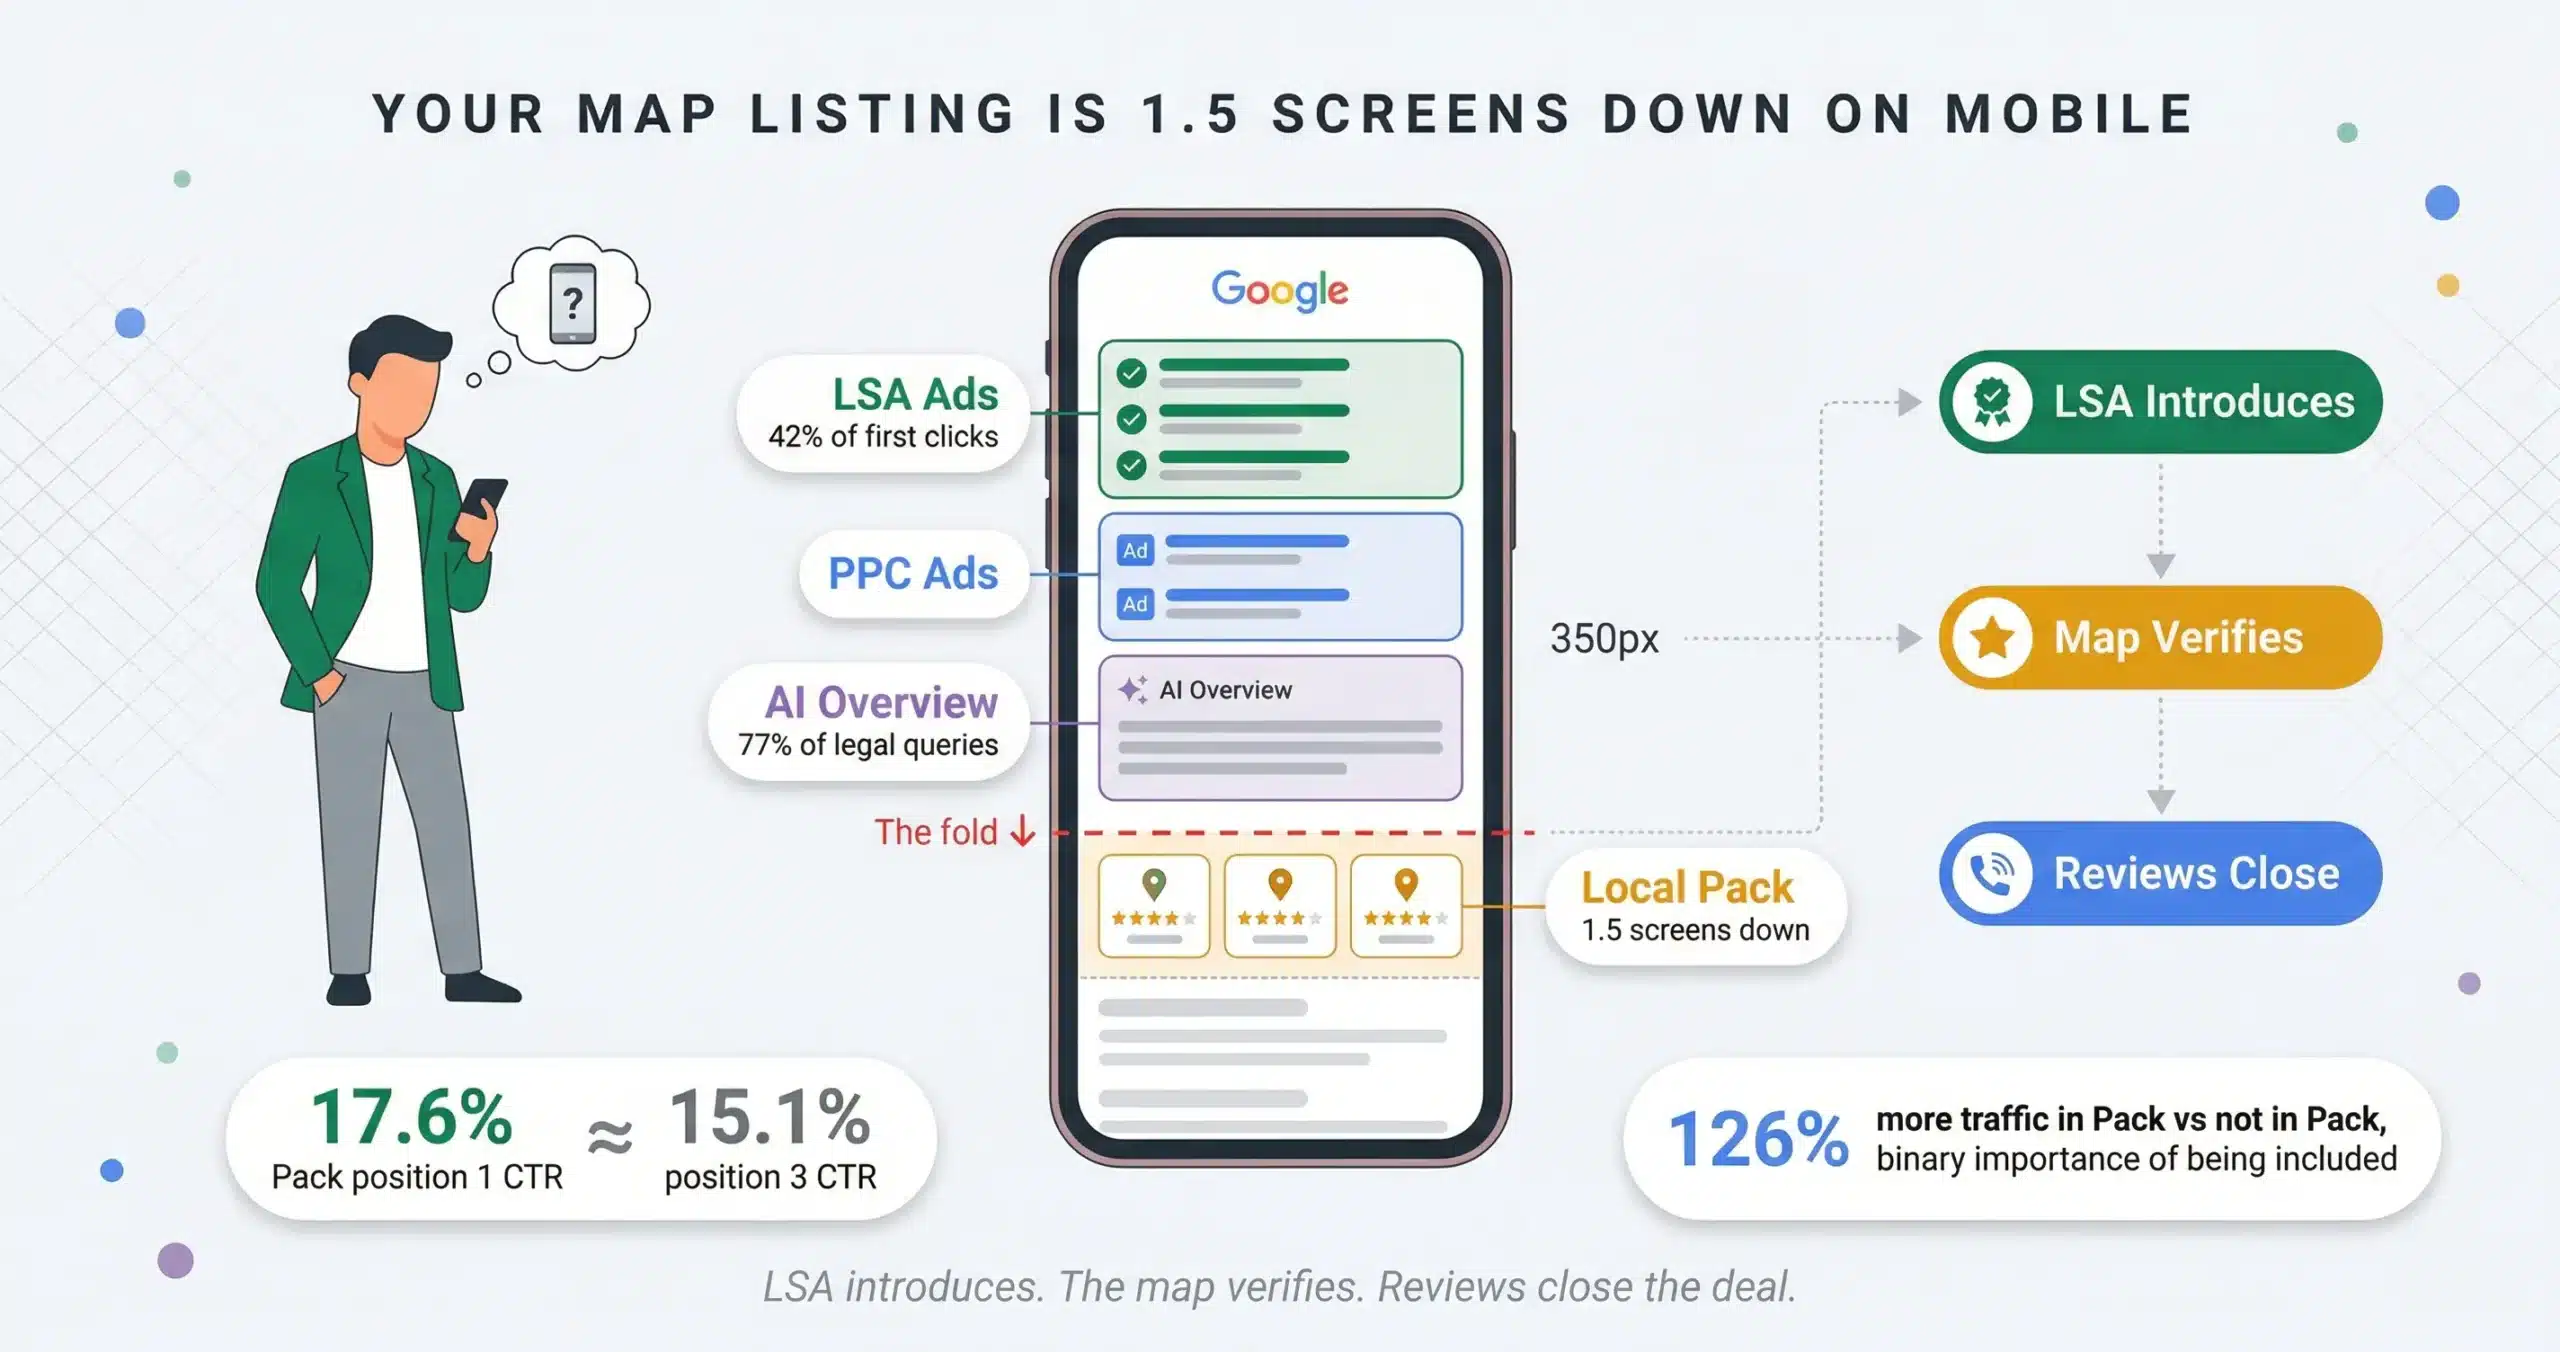
The Local Pack stopped being a discovery engine sometime in the last 18 months and most firms haven’t noticed. LSAs now capture 42% of first clicks on mobile legal searches. The organic map results require 1.5 screens of scrolling to reach. AI Overviews trigger on 77.67% of legal queries and drop organic CTR by 61%. But 68% of users still trust the map results more than the ads above them, which means the map pack became a verification step, not a first impression. I think of the whole search results page as a vertical funnel now; the LSA buys the introduction, the map confirms the trust, and the reviews close the deal.
THE SCROLL TAX ON MOBILE: WHAT THE USER ACTUALLY SEES BEFORE YOUR MAP LISTING
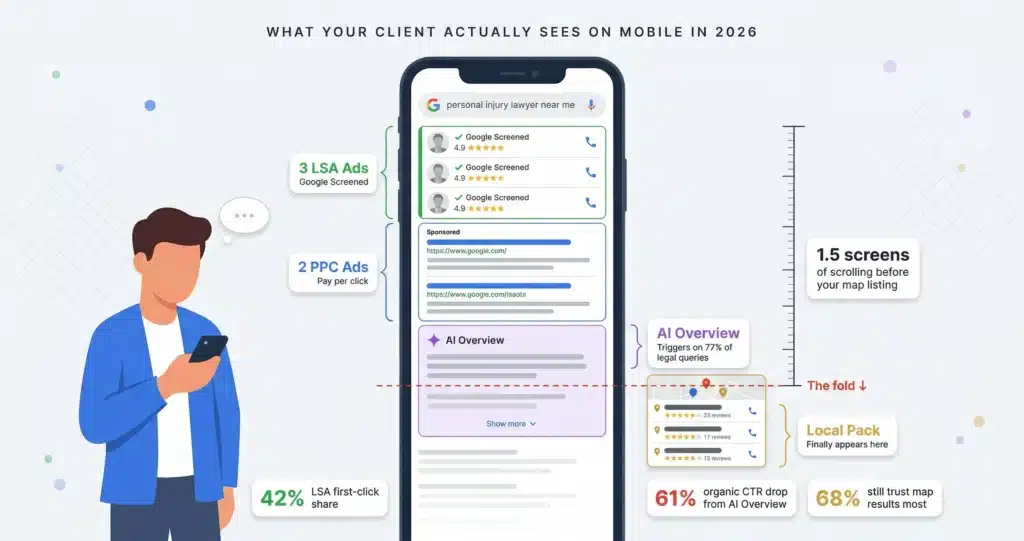
Screen Position 1 (Visible on Load)
3 Local Service Ads with Google Screened badges. Combined first-click share: 42%. Left box 3.1%, Middle 2.8%, Right 2.5%, plus expansion link.
Screen Position 2 (First Scroll)
2 to 3 Paid Search Text Ads. Standard PPC results. CTR drops 68% when AI Overviews are also present on the page.
Screen Position 3 (AI Overview Zone)
Google AI Overview. Triggers on 77.67% of legal queries (highest of any industry). Drops organic CTR by 61% when present.
Screen Position 4 (1.5 Screens Down)
The Local 3 Pack. Your organic map listing finally appears here. 0% visible on initial screen load.
Below the Fold
Standard organic results. Positions 4 through 10. At this depth, you’re invisible to 90%+ of mobile users.
I think of that 1.5 screen scroll distance as a tax because that’s exactly what it is; Google charges you visibility at the top through LSAs and PPC, and if you don’t pay, the user has to work to find you organically. And the behavioral split is what makes this interesting.
If you rely on the Local Pack for DUI leads, you’ll starve. You have to pay the LSA tax to participate in the crisis market at all. But if you’re a family law or estate planning firm, the map pack is still your best conversion channel because research-intent users actively seek it out. The Near Me revenue engine page covers the full LSA economics; this page is about how the paid and organic layers interact on the same results page.
LOCAL PACK CTR DATA BY POSITION: 17.6% VS 15.4% VS 15.1% AND WHY THE DROP IS ALMOST FLAT
And here’s the part that surprised me when I first saw the data. In regular organic search there’s a massive CTR cliff between positions 1 and 2 and 3. In the Local Pack the three slots are almost flat.
The gap between first and third is only 2.5 percentage points. So being in the pack matters far more than being at the top of it. But being in the pack versus not being in it is a different story; firms in the Local 3 Pack get 126% more traffic and 93% more direct actions like phone calls and map direction requests than firms ranking fourth through tenth.
THREE GBP MISTAKES THAT SUPPRESS YOUR LOCAL PACK RANKING AND MOST AGENCIES MISS
And I keep running into the same three problems when I audit Google Business Profiles for law firms, and the reason they’re so common is that none of them are obvious and most agencies don’t check for them.
Want to know your category count and review velocity right now?
Free GBP AuditTHE VERTICAL FUNNEL: LSA INTRODUCES, MAP VERIFIES, REVIEWS CLOSE
I think of the entire search results page as one funnel now instead of three separate channels competing with each other, and once I started looking at it that way the strategy got a lot simpler. The user sees your LSA at the top and that’s the introduction. Then they scroll to the map and that’s the verification; they’re checking your rating, your review count, and whether the most recent review is from last week or last year. And then they either call from the map listing or Google your name directly to verify one more time.
“Research shows a 2.1x True Contacts Multiplier for law firms; for every 10 contacts you can track, another 11 happen off-platform through branded searches and direct calls your analytics can’t see.”
And this is why the branded keywords page connects to this one. If the user sees your LSA, scrolls to the map, likes your reviews, and then Googles your firm name to verify, you need to own that branded search too or a competitor’s ad shows up when the person was trying to find you specifically. The vertical funnel only works if you own all three layers; the LSA for the introduction, the map listing for the verification, and the branded ad for the close. Drop any one of them and you’re leaking cases at the exact point where the person was ready to call, which I think is worse than not showing up at all because at least when you’re invisible you’re not paying for the attention you wasted.
The attribution trap: Your map listing is doing more work than your analytics can see. That 2.1x multiplier means cutting your GBP optimization budget because the dashboard doesn’t show direct attribution is one of those decisions that looks smart in the spreadsheet and costs you cases you’ll never know about. The Google Ads cost page covers the full conversion funnel math and why cost per signed case is the only metric that matters.
Want to see where your firm sits in the vertical stack?
Search your top practice area from a phone right now and count how many screens you scroll before your map listing appears. If it’s more than one screen and you’re not running LSAs, the crisis market can’t find you. Send me the screenshot and I’ll tell you what’s missing at each layer and what it would cost to close the gap. If you’re already dominating the stack I’ll tell you that too and you can move on to something else.
Related: Near Me Revenue Engine · Branded Keywords Defense · Google Ads Cost and ROI · AI Overviews Impact · SEO for Law Firms