


TL;DR
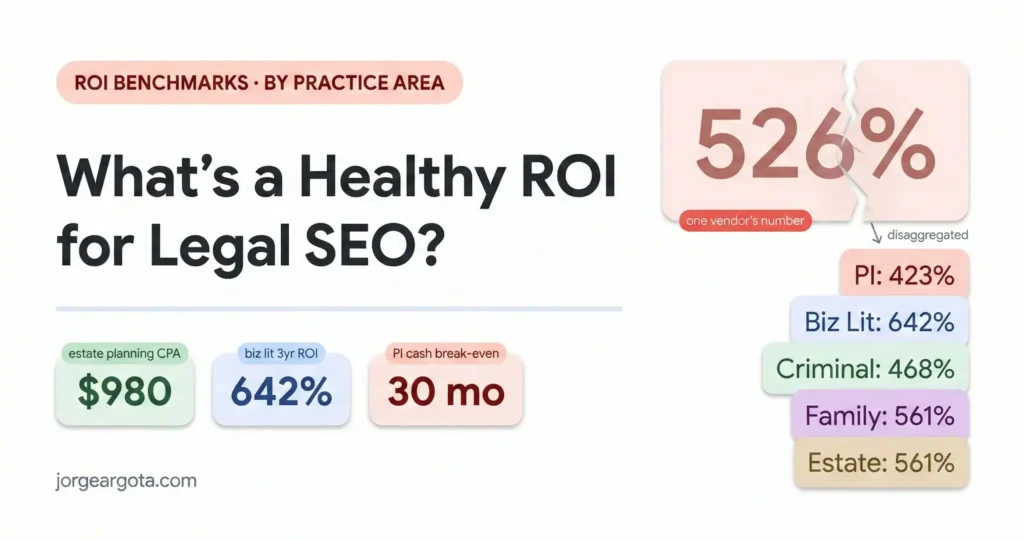
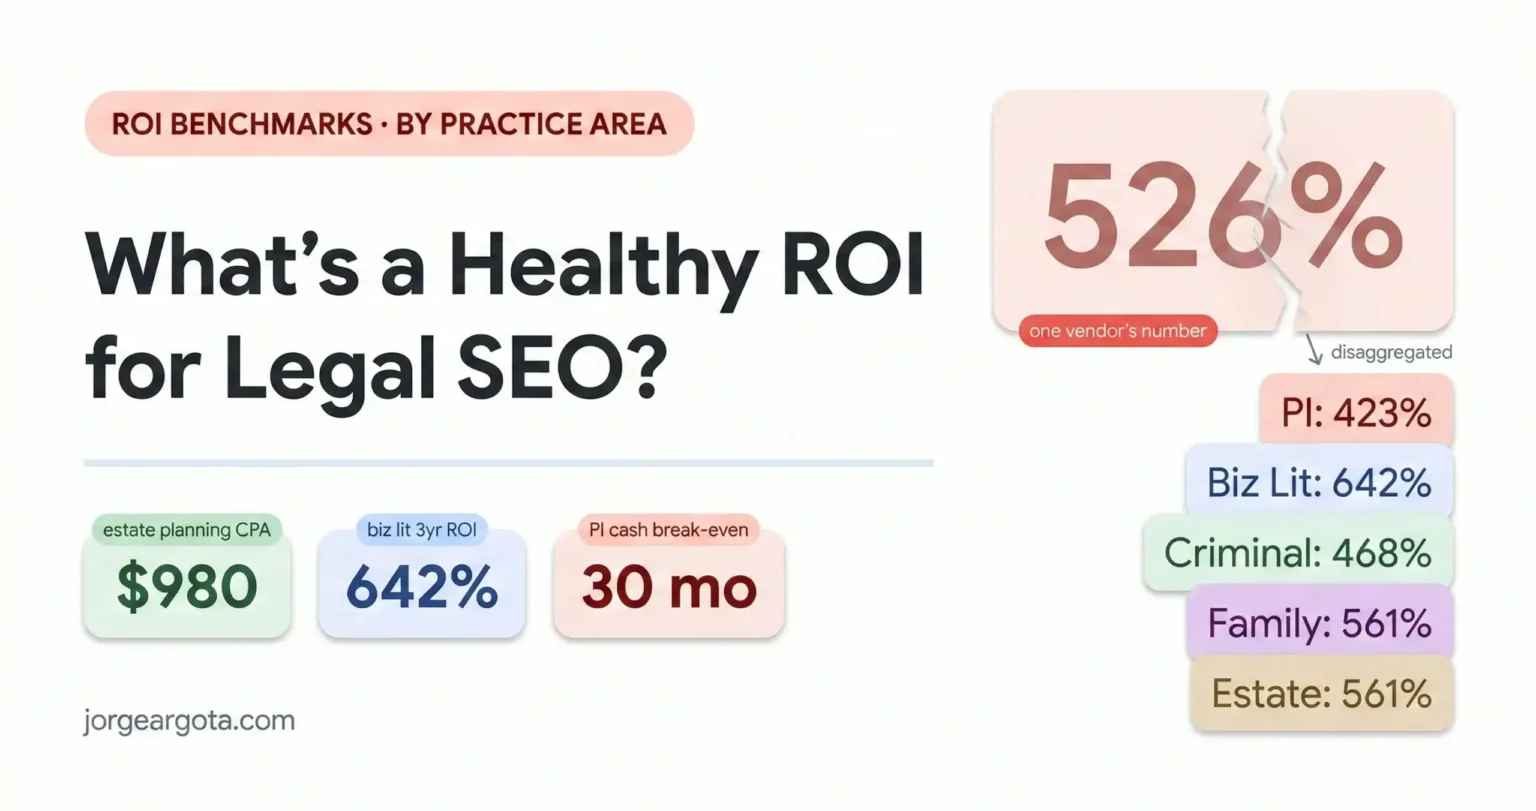
A 5:1 revenue to cost ratio is the floor for healthy law firm marketing. Below 3:1 you’re losing money after overhead. At 10:1 you’re building real profit. The math changes completely by practice area; PI operates like venture capital with 24 month payback cycles, criminal defense converts in 60 to 90 days, and estate planning ROI lives in lifetime client value not the first fee. The “526% average” every agency quotes traces to one vendor’s client book and doesn’t apply to most firms. Three formulas matter: Standard ROI (use net profit, not gross), Revenue to Cost Ratio (5:1 healthy, 3:1 danger zone), and Cost Per Signed Case (check weekly, not monthly). Present it to partners using vintage year analysis and pipeline value forecasting so the conversation is “when does this batch mature” instead of “why are we spending this.”
Source: Jorge Argota, 10 years legal marketing, former Marketing Director at Percy Martinez P.A. Data from First Page Sage (49 PI firms, $21.4M spend), LocaliQ (256 legal campaigns), Clio Legal Trends Report (1,702 respondents), and Martindale Nolo intake benchmarks. The 526% figure is traced to its original single vendor source throughout this page.
THE CAPITAL EFFICIENCY SPECTRUM
Deficit Threshold
Below 3:1
Capital drain after overhead. At this ratio the marketing costs more to deliver than it returns once you subtract attorney time and firm expenses.
The Floor
5:1
Minimum for scalability. The marketing pays for itself and the work it creates, with enough margin left for profit.
Strong Performance
10:1
Mature SEO driving free traffic, a high converting intake process, or a practice area where one case covers the quarter.
Unicorn Event
20:1+
Referral networks built over decades or a single mass tort settlement. Don’t budget around this number repeating.
Below the 3:1 deficit threshold and you’re losing money after attorney time and overhead. I’ve seen firms run campaigns at 2:1 for a year before someone finally does the math. At 10:1 you’re usually seeing mature SEO traffic that costs nothing per click, an intake process converting 20 to 30% better than average, or a practice area where one case covers the quarter. If you’re wondering which lever to pull first, intake speed is almost always the cheapest to fix. As a rough benchmark, most healthy firms spend 8 to 12% of gross revenue on marketing for maintenance and 15 to 20% during aggressive growth phases; anything above 20% without matching revenue growth means the spend is eating into profit. And the reason I use analogies like “high alpha capital” and “immediate response protocol” instead of marketing jargon is because these are investment decisions, not ad campaigns; your partners should be looking at marketing spend the same way they look at hiring a new associate or opening a second office.
PI = High Alpha Capital Allocation. High risk, high reward. You accept $1,500 to $3,000 per signed case to purchase an asset that matures in 18 to 36 months. This is an equity investment, not a cash flow play.
Criminal = Immediate Response Protocol. 67% hire the first attorney who answers. ROI here is a function of speed, not just spend. Miss the 2 AM call and the capital is wasted instantly.
Family = Reputation Based Growth. Reviews and reputation drive conversions more than ads. The real ROI is realized over 3 to 5 years through custody modifications, asset division updates, and referrals.
Estate = The Annuity Model. First fee ($2,500 estate plan) is a loss leader. The ROI lives in generational transfers, updates, and probate administration. True lifetime value often reaches $15,000 or more. Measuring this on a 30 day cash basis guarantees a false negative.
SEO is a savings account. Paid search is a paycheck. You need the paycheck to pay the bills, but the savings account is what eventually makes you wealthy. The three year SEO return runs 400 to 500% but it’s back loaded; the first 14 months are usually a net loss. Paid search delivers around 2:1 immediately but the cost never goes down and stops the moment you stop paying. The firms that cut SEO first when things get tight are emptying their savings to cover one month. But fair warning; SEO isn’t a set it and forget it savings account. It requires ongoing content and maintenance, and if a competitor enters your market in month 10 and outspends you, your 14 months of work can stall. Think of it more like equity in a property; it builds real value over time but you still have to maintain the building.
WHEN TO MEASURE ROI (DON’T PULL THE PLUG TOO EARLY)
DUI and traffic defense: Measure in 90 days. Retainers collect fast. Family law: Measure in 90 to 120 days. Retainers plus initial billing. Criminal defense: Measure in 60 to 90 days. Fastest cash cycle in legal. Estate planning: Measure the first fee in 90 days but track lifetime value over 3 to 5 years. PI and med mal: Your ROI might look like 0:1 for 24 months and then jump to 50:1 in a single day when a case settles. Partners who evaluate PI marketing on a quarterly P&L will kill the campaign before it pays off every single time. And compare year over year, not month over month; criminal defense spikes during holidays and summer, estate planning spikes in January and April, and if a partner looks at a 90 day report during a seasonal dip they’ll cut a campaign that’s actually healthy.
HOW TO ACTUALLY CALCULATE YOUR MARKETING ROI
I spent years at Percy calculating ROI wrong because I was using the numbers the agencies gave me instead of the numbers from our case management system. Phone calls aren’t revenue. Leads aren’t cases. Three formulas matter.
True Net ROI
(Net profit from cases − fully loaded marketing cost) ÷ fully loaded marketing cost × 100
“Fully loaded” means everything: ad spend plus agency fees plus software like call tracking. Most agencies only count the ad spend to make the number look better. And using gross settlement instead of net profit inflates this by 300%.
Revenue Ratio
Gross revenue ÷ total marketing cost
Quick pulse check. 5:1 is healthy. Below 3:1 is the deficit threshold. If it drops below 5:1, investigate immediately.
CPA (Cost Per Acquisition)
Total spend ÷ signed retainers
The single most actionable metric. Check weekly. If CPA spikes, check intake speed first, then ad targeting. Forces marketing and intake to own the number together.
THE TRUE R.O.I. CALCULATOR: GROSS VS. NET
Gross Revenue Ratio
0.0:1
Healthy
True Net R.O.I.
0%
After firm overhead and margin
Drag the sliders to match your firm. Notice how a seemingly “good” Gross Ratio can produce a negative True Net ROI when margins are tight.
Roughly 53% of law firms believe they've wasted money on marketing campaigns that didn't produce results. But the problem usually isn't that paid search doesn't work; it's that most firms can't connect the ad spend to the signed case because they don't have the tracking in place. Without that connection it feels like you're paying a tax instead of making an investment, and the anxiety gets worse every time you see a $200 click that you can't trace to a retainer. Close the tracking loop so every click follows through to the signed case and the conversation changes overnight.
The attribution problem underneath all of this: A client might read your blog post from organic search on Monday, leave, talk to their spouse, then click your Google Ad on Friday to call. If you only credit the last click, you'll cut the SEO budget that actually started the relationship. Use call tracking integrated with your case management system to see the full path from first search to signed retainer. Both channels deserve credit for the case they produced together.
How often to check: cost per signed case and lead to sign conversion rate every week. Revenue to cost ratio and channel comparison every month. True ROI including net profit and pipeline value every quarter. The key is that your intake team marks the lead source when the contact comes in. They update the status when the retainer gets signed. Without that data entry, no formula works. And if your lead to sign conversion rate is running below 30%, the problem is almost always intake quality, not marketing quality; your team may be slow to respond, failing to qualify properly, or losing people during the consultation scheduling process. And categorize every "no" in your system; if half your rejected leads are in the wrong geographic area or the wrong case type, that's a marketing targeting failure, not an intake failure, and feeding those rejection reasons back to whoever runs your ads lets them add filters that stop paying for the wrong leads before they ever reach your phone. Every hour your intake team spends talking to someone who will never sign is wasted payroll that doesn't show up on any agency report but absolutely shows up on yours. Early in my career I corrupted my own data for months because our intake team marked every lead source as "website." That told us nothing about whether the case came from SEO, Google Ads, or a Facebook campaign. Until we fixed our source attribution, our ROI calculations were expensive guesses. And one more thing most firms miss; if a lead doesn't sign today but comes back six months later through an email drip or a second phone call, credit the original marketing source that brought them in the first time. Otherwise you're undervaluing every channel that produces "not yet" leads, which in estate planning and family law is most of them.
Why spending more on the same channel eventually stops working: Think of it like fishing in a small pond. There are only so many people searching for a lawyer in your zip code today. Your first $10,000 in Google Ads catches the people at the surface who are ready to hire right now. Once you capture that core search volume, the only way Google can spend your next $10,000 is by showing your ads to people who are less ready (browsing, comparing) or by forcing you into bidding wars for broader, less relevant keywords where the clicks cost more and convert worse. The industry calls it Bid Inflation but the simple version is that Google ran out of cheap fish and now you're paying premium prices for the hard to catch ones. We learned this the hard way early on: we doubled our PPC spend one quarter expecting twice the cases. Cost per signed case went up 40%. Case volume only went up 15%. The fix wasn't more money on the same channel. It was moving that incremental budget to a different channel (like Local Service Ads or SEO) where the easy conversions hadn't been picked over yet.
HOW TO PROVE ROI TO YOUR PARTNERS
Partners don't care about clicks or cost per lead. They care about two questions: is this money coming back, and when. The gap between what marketing reports and what partners actually ask in meetings is why budgets get cut in lean quarters even when the campaigns are working.
Give cases an estimated value the day they sign, not the day they settle. If your surgical error cases average $800,000 settlement with a 40% success rate and a 40% contingency fee, a new signed surgical error case is worth roughly $128,000 in projected fees. When a marketing campaign signs that case, the dashboard credits $128,000 right away instead of showing $0 for 24 months while the case works through litigation. It's a projection, not a guarantee, but it's infinitely better than a blank revenue column while partners wonder why they're writing checks. And build in a discount; cases drop, defendants turn out to be underinsured, liens eat the fee. If your historical collection rate on signed cases is 70%, multiply the projected value by 0.7 so the dashboard reflects what you'll actually collect, not what you hope to collect.
The framework that changed how I present numbers to partners works like this: stop evaluating marketing month by month. Instead, group everything by the year it was spent. Your 2024 bucket includes every marketing dollar spent this year plus every fee collected from cases signed this year; even if that check doesn't clear until 2027. Private equity calls this "vintage year analysis" but the plain version is just tracking each year's marketing as its own investment with its own return. Practically, this means tagging every new client file in your case management system with its acquisition year. When a 2024 case finally settles in 2026, your accounting team credits that fee back to the 2024 marketing ledger. The conversation in the boardroom immediately shifts from "why are we spending this" to "when does this batch mature."
THE 6 METRICS ON THE PARTNER DASHBOARD (EXCLUDE EVERYTHING ELSE)
1. Pipeline Value: Total projected fees from all active cases sourced by marketing (discounted by your historical collection rate). 2. Vintage ROI: Return on marketing spend grouped by the year it was invested, not the year revenue arrives. 3. Acquisition Cost Per Matter: The fully loaded cost (ad spend plus agency fee plus intake time) to sign one retainer, by channel and office location. 4. Marketing Ratio: Total marketing spend as a percentage of gross revenue (8 to 12% for maintenance, 15 to 20% for growth). 5. Lead Velocity: Whether your monthly qualified lead count is going up or down (predicts revenue 12 to 18 months from now). 6. Lead Quality Ratio: What percentage of leads are actually qualified (tells you whether marketing is bringing the right people or filling the phone with calls that will never sign). Everything else; click rates, impressions, bounce rates, cost per lead; is operational data for the marketing team and doesn't belong in a partner meeting.
Why the trend in your lead count matters more than this quarter's revenue: Revenue tells you what happened two years ago. The direction your leads are moving tells you what's going to happen two years from now. If your qualified leads are growing 10% month over month, future revenue growth is built in even if this quarter's collections are flat. If your lead count is declining, the firm has a revenue problem that won't show up in collected fees for 18 months. By the time you notice the drop, it is far too late to fix it with an ad budget increase.
About the data on this page: Practice area benchmarks are sourced from First Page Sage (49 PI firms across 36 states, $21.4M annual spend, 2026 report) and LocaliQ/WordStream (256 US legal campaigns, April 2022 to March 2023). The 526% ROI figure is traced to First Page Sage proprietary client data and is not an independent industry study. Intake benchmarks are from Clio's 2024 Legal Trends Report (secret shopper study of 500 firms by third party research firm Lux) and Hennessey Digital's 2025 response time study (approximately 1,300 firms, fifth annual study). Every data point carries the bias of its source; agencies produce numbers that make their services look effective, and software companies produce numbers that make their tools look necessary. I've noted the source and its potential conflict wherever possible so you can decide what to weight. This page is written by Jorge Argota; 10 years in legal marketing, former Marketing Director at Percy Martinez P.A., University of Miami BBA, Google Ads certified.
Send me your last 90 days. Marketing spend by channel and the number of cases signed from each through the contact page. I will run your Pipeline Value Forecast and tell you exactly what your True Net ROI is; not the gross number that looks good on a report but the actual number after overhead and margin. If your current agency is producing strong returns I will tell you to stay with them. If you are bleeding money somewhere I will show you exactly where the leak is.