How do you prove marketing ROI to law firm partners? By translating marketing metrics into financial metrics. Partners don’t evaluate clicks or cost per lead; they evaluate capital allocation and return timelines. The frameworks that work are vintage analysis (evaluating marketing spend by the year it was invested, not the year revenue arrives), pipeline value forecasting (assigning projected case values at signing instead of waiting years for settlements), payback period reporting (answering “when do I get my money back”), and a dashboard that shows marketing contribution to firm revenue as a percentage, not a list of impressions.
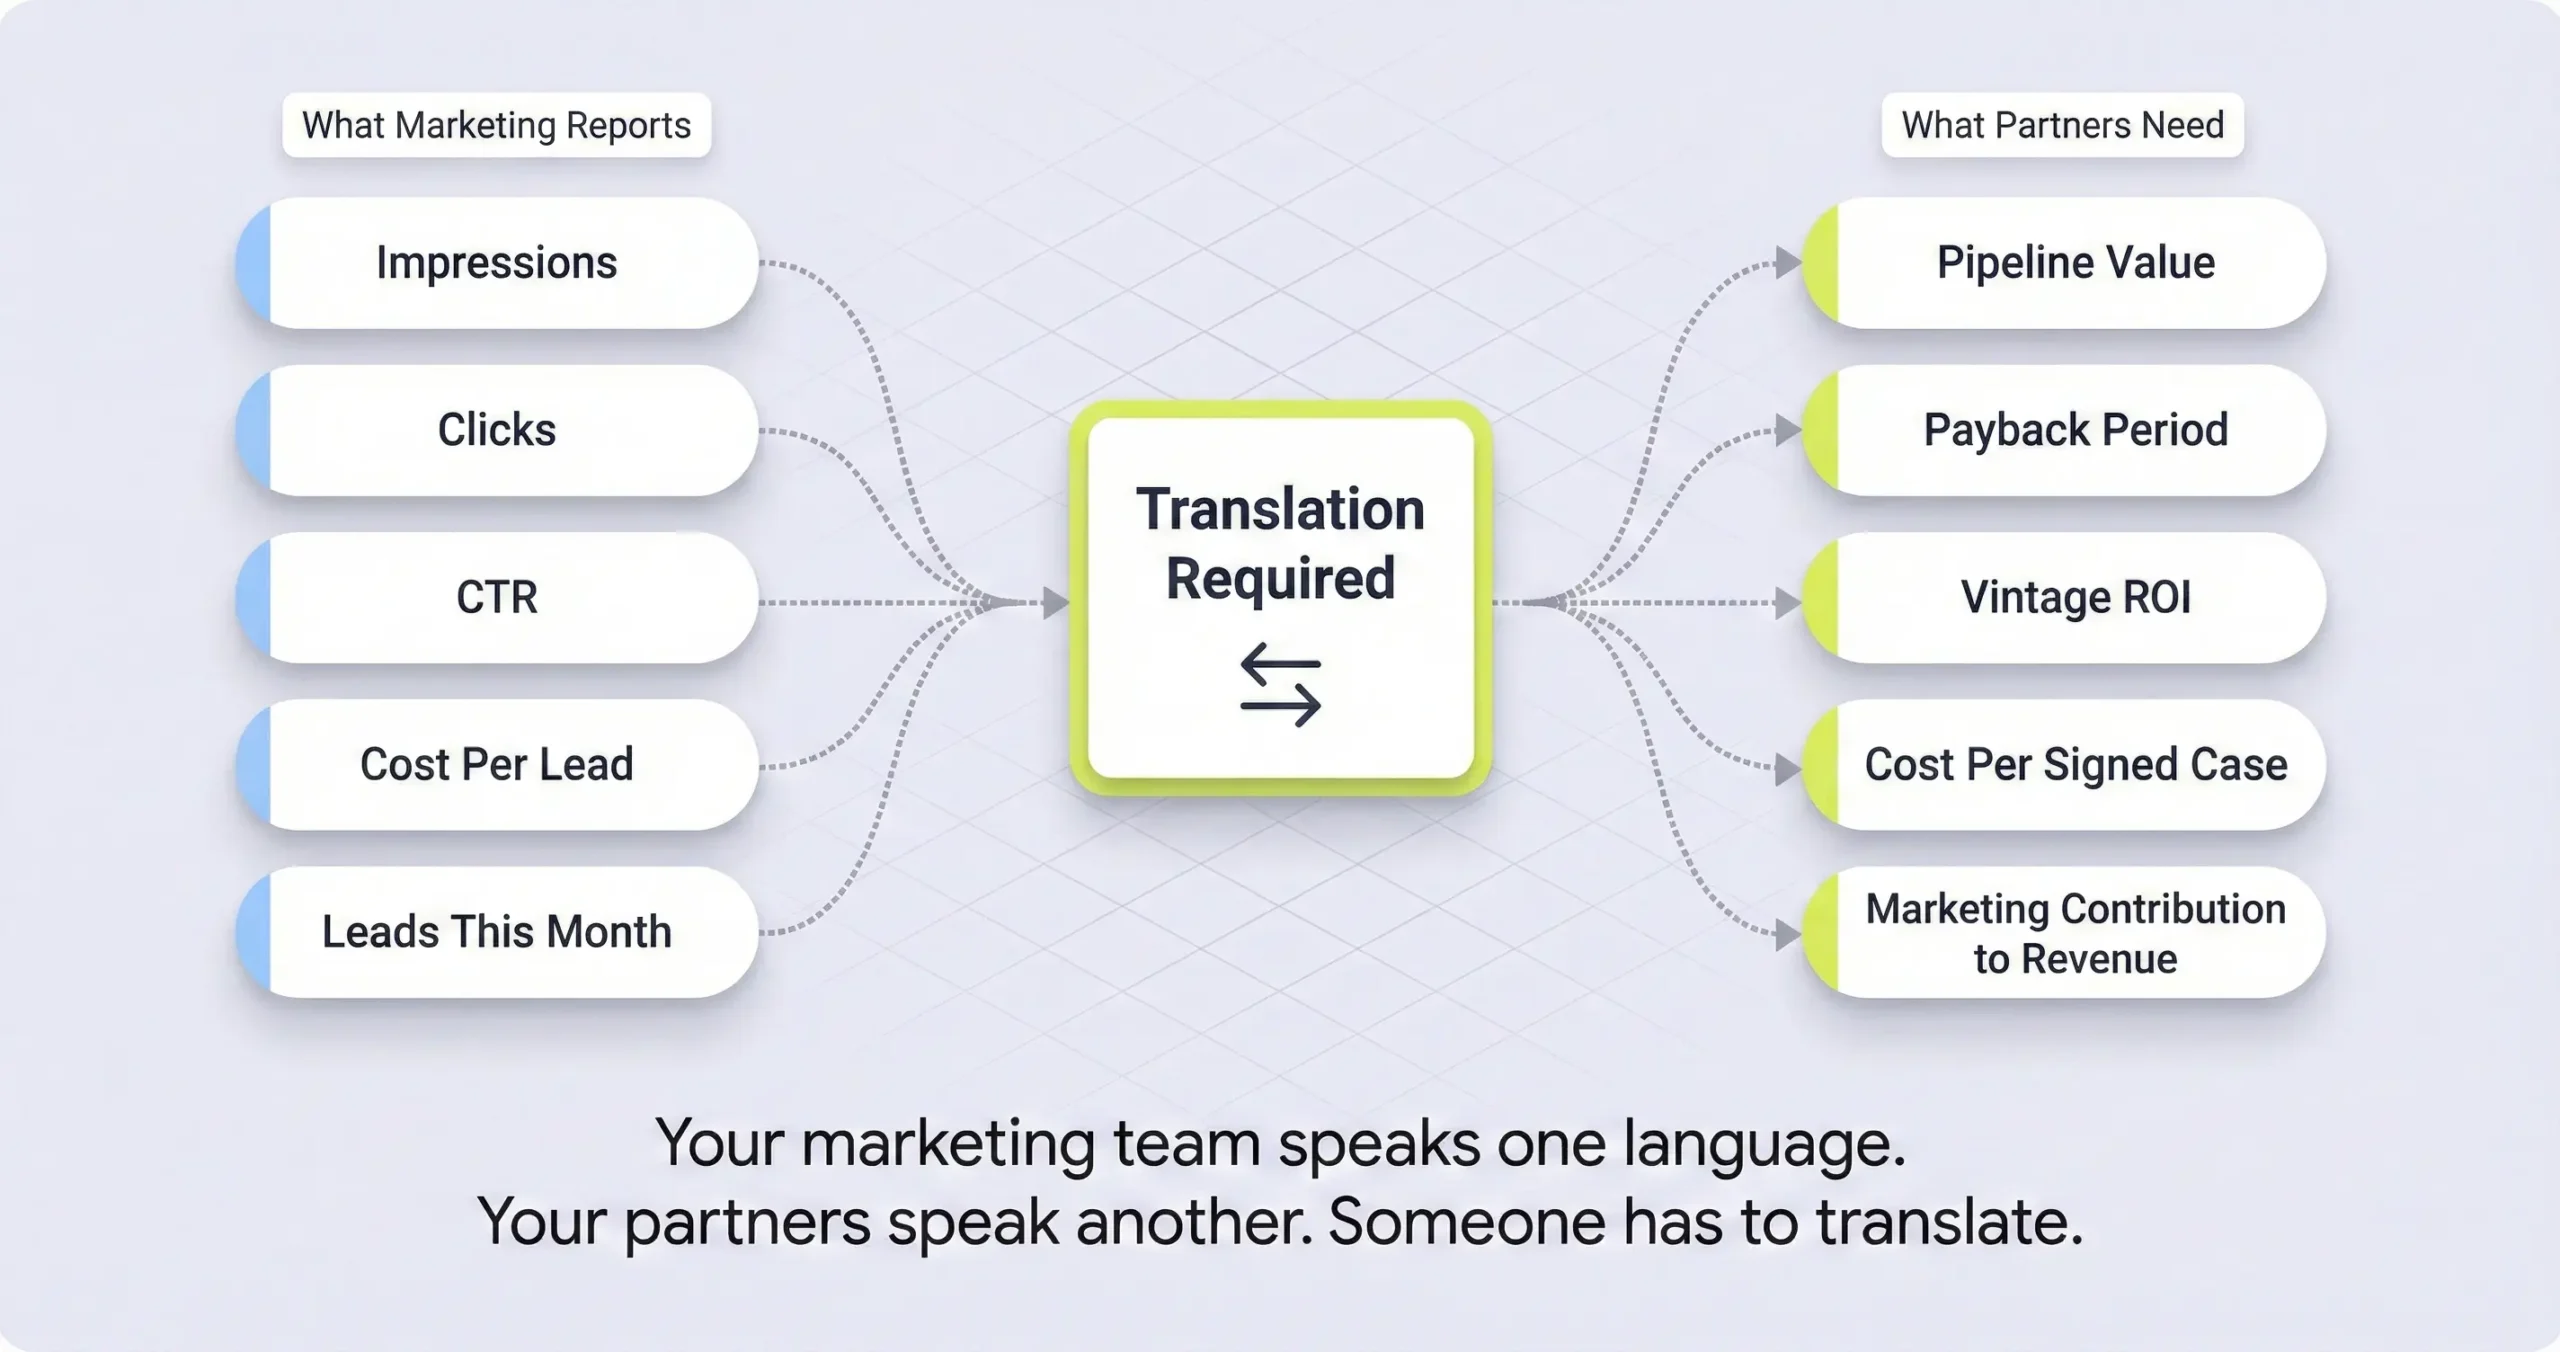
Managing partners don’t care about click-through rates. They care about whether the $40,000 they spent on marketing this quarter is coming back as signed cases and when that money turns into collected fees. And most marketing reports don’t answer either question because they’re built in marketing language; leads, impressions, cost per click; instead of financial language; projected revenue, acquisition cost as a percentage of expected fee, and the timeline from spend to collection.
That gap between what gets reported and what gets asked in the partners meeting is why marketing budgets get cut in lean quarters even when the campaigns are working. The partners aren’t seeing evidence that the spend produces revenue because nobody translated the data into terms that connect to the P&L, and when money gets tight the line item that can’t defend itself in financial terms is the first one that goes.
These are the frameworks that close that translation gap, and they work whether the firm has two partners or twenty, because the question is always the same; “is this spend coming back as revenue and how long does it take.”
Why Monthly P&L Reporting Destroys Marketing Budgets
Why do law firm partners cut marketing budgets during lean quarters? Because marketing expenses are immediate and certain while case revenue is delayed and uncertain. A med mal case signed this month might not settle for 24 to 36 months. If the firm evaluates marketing performance on a monthly P&L, the spend always looks like a loss because the revenue from that spend hasn’t arrived yet. This creates a J-curve where the first 12 to 18 months of any marketing investment show negative returns, which triggers budget cuts exactly when the pipeline needs more investment.
The way to fix this is borrowed from private equity, where funds are evaluated by vintage year instead of calendar year. A 2024 marketing vintage includes everything you spent in 2024 and all the revenue that eventually comes from cases signed in 2024, even if that revenue doesn’t arrive until 2027. When you track vintages, the partner can see that the 2022 vintage is currently delivering a 4x return even though the 2024 vintage is still negative, which means the current spend is building the same kind of return that the 2022 spend already proved.
This was the shift that changed how I presented the numbers. Instead of showing a monthly statement that said “we spent $40,000 and collected nothing” I could show that cases signed from marketing 18 months ago had generated fees that more than covered the spend, and that the current month’s spend was building the same kind of inventory. The conversation went from “why are we spending this” to “when does this batch mature” which is a different conversation and a much more productive one.
How to Assign Value to Cases Before They Settle
How do you report marketing ROI when cases take years to settle? By assigning a projected value at the time of signing based on historical data. If your firm’s surgical error cases in your jurisdiction settle for an average of $800,000 with a 40% success rate and a 40% contingency fee, a new signed surgical error case has a projected fee value of $128,000. When a marketing campaign generates that case, the dashboard credits the campaign with $128,000 in pipeline value instead of showing zero revenue until the case settles two or three years later.
This is called probability-weighted expected value and it sounds technical but the concept is simple. You multiply the average case value by the success rate by your fee percentage, and that gives you a projected number that’s grounded in your own historical outcomes. It’s not a guarantee and you should present it as a projection, but it’s infinitely better than showing partners a blank revenue column for 24 months while the cases work through litigation.
The data for this comes from your case management system. You segment historical cases by type and jurisdiction, pull the averages, and apply them to new signings. If your firm has been practicing med mal for a decade you probably have enough data to build a reasonable model, and if you’re newer you can use industry benchmarks as a starting point and refine them as your own data accumulates.
The number I found most useful at Percy was showing the total pipeline value of all active marketing-sourced cases as a single number on the dashboard. Instead of “we spent $50,000 this month and signed 3 cases” the report said “we spent $50,000 and added $380,000 in projected pipeline value” and that reframing made the investment visible in a way that monthly spend reports never could.
The Payback Period and Why It Matters More Than ROI
What is the payback period for law firm marketing? It’s the time between spending the marketing dollar and collecting the fee from the case that dollar generated. For PI it might be 12 to 18 months. For med mal it’s often 24 to 36 months or longer. The payback period is the metric that answers the partner’s actual question, which isn’t “what’s the ROI” but “when do I get my money back.” Showing a payback period of 28 months with a projected 4x return is more credible than showing an ROI percentage without a timeline.
The payback period also reveals where marketing can add operational value beyond lead generation. If marketing can shorten the time between a lead coming in and the retainer getting signed through better intake processes and automation, the payback period improves even if the case litigation timeline stays the same. Shortening lead velocity by even two weeks across 50 cases a year compounds into meaningful cash flow acceleration.
Lead velocity rate is the other metric partners should see because it’s a leading indicator instead of a lagging one. Revenue tells you what happened two years ago. Lead velocity tells you what’s going to happen two years from now. If qualified leads are growing 10% month over month, revenue growth is baked in even if the current quarter’s collections are flat. If lead velocity is declining, the firm has a revenue problem that won’t show up in the P&L for 18 months, and by then it’s too late to fix with a budget increase.
What the Partner Dashboard Should Actually Show
What metrics should law firm partners see on a marketing dashboard? Five things: total pipeline value of all active marketing-sourced cases, vintage ROI for the past three years of marketing spend, cost per signed case by channel and by office location, marketing contribution to total firm revenue as a percentage, and lead velocity rate trending month over month. Everything else like click-through rates, impressions, bounce rates, and cost per lead is operational data for the marketing team and doesn’t belong in a partner report.
The rule I follow is that if a metric can’t be connected to revenue or a revenue projection, it doesn’t go on the partner dashboard. A partner who sees “15,000 impressions” gets nothing useful from that number. A partner who sees “marketing contributed 42% of firm revenue this quarter, up from 35% last quarter” understands that the marketing investment is working and scaling.
For multi-office firms the dashboard needs to break cost per signed case by location because blended numbers hide problems. A firm might see “average CPSC of $2,500” and feel good about it while the established Miami office is at $1,200 and the new Tampa office is at $5,000. Both numbers are reasonable in context but the partner needs to see them separately to make informed decisions about where to allocate the next dollar.
The replacement value of organic content is another number that resonates with partners who think in terms of assets. If a blog post ranks for a keyword that costs $100 per click in Google Ads and that page gets 1,000 visitors a month, the page is generating $100,000 in equivalent ad value. That’s a tangible asset the firm owns, and framing it that way helps partners understand why the SEO investment keeps paying returns long after the initial cost is recouped.
Need help building the partner dashboard?
Send me your practice area mix and I’ll build a framework showing pipeline value, vintage ROI, and payback period projections based on your case types. If your current reporting is already working I’ll tell you.